
Ready for action!
Most of the work has been done for now. Today I added the last couple of isotopes that I had lying around to the database and finished up all the remaining pages.
You can now browse the database in its (mostly) finished form and look at all the beautiful HPGe spectra. At this point in time all the most commonly used radioisotopes are here as well as a ton of other isotopes mainly used in nuclear medicine. I hope to expand the scope of the different individual detectors on top of the HPGe detector. This includes, of course, scintillation detectors as they are the only real way for hobbyists and “normal” people to get into gamma spectroscopy. But I need your help with this! I can probably count the amount of isotopes I have lying around and have access to on one hand. In the future I am definitely planning on getting access to some more exciting ones than just Am-241, but for now I need your help. Feel free to add your own spectra to this database!
Contributing
You can add to any of the existing radioisotopes if your detector hasn’t been featured there already or if you’re spectrum is in any kind special (like better resolution, less noise, etc.). You can also add an entirely new isotope to the list!
To do so, you only have to provide the energy spectrum files and your detector calibration file. These must be compatible with the Gamma MCA app as that’s the tool I am using to export the HTML plots. Optionally, you can also include a fitting background spectrum. Unfortunately, simply exporting images of your spectrum is not enough as there are plenty of other static databases and this would also break uniformity in the page. Having a lightweight Javascript plot to look at the spectra is just so much better, even just for the sake of zooming into the image without having to look at a pixelated mess.
Compatability
To check file compatability you can do so directly in Gamma MCA, here’s a screenshot:
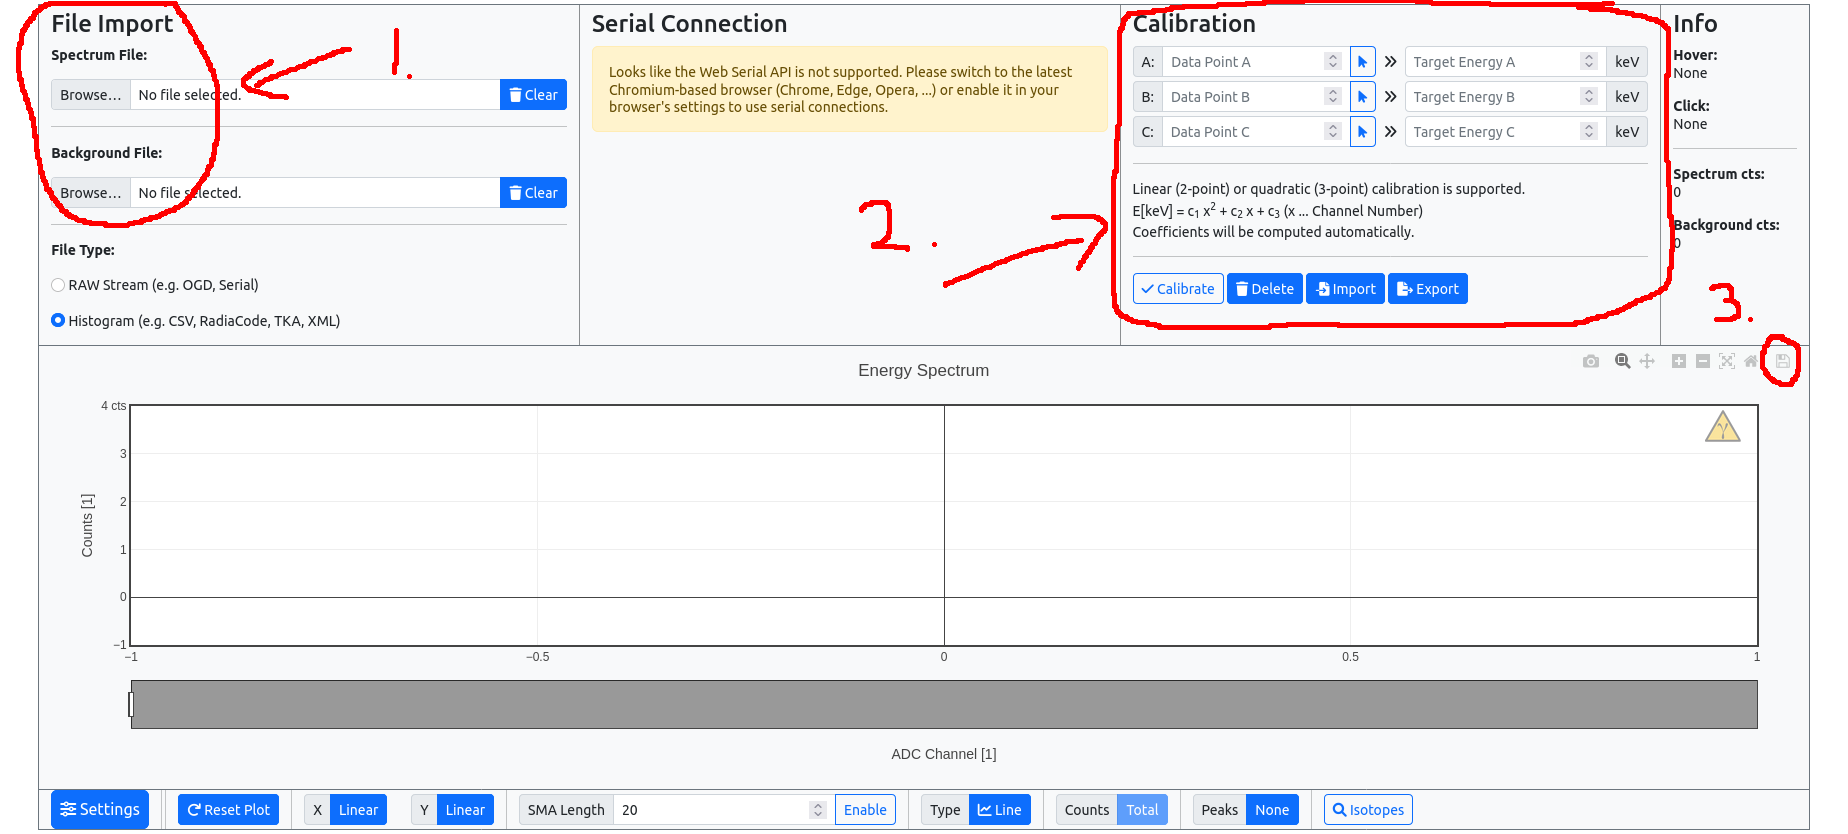
- Import your energy and background spectrum files. These can be pretty much any common file format, like CSV, TKA, XML, etc. If that works out and you can see your spectrum in the plot below, go to the next step. Otherwise, please submit an issue on GitHub, see below.
- You can do up to a 3-point calibration by selecting points in the plot and assigning the correct energy. This will create a calibration file in the background (don’t forget to hit
Calibrateand check) that you have to export again by simply clicking onExport. - This step is optional: If you imported all the files and applied the calibration, you can also directly export the plot as an HTML file by clicking the floppy disk icon. You can attach this too when submitting, but you really don’t have to.
Now you should have 2 - 4 files: the energy spectrum, (ideally background,) calibration (and HTML file).
GitHub
The submission process is pretty straightforward. There are essentially three places for us to interact: issues, pull requests and the discussions.
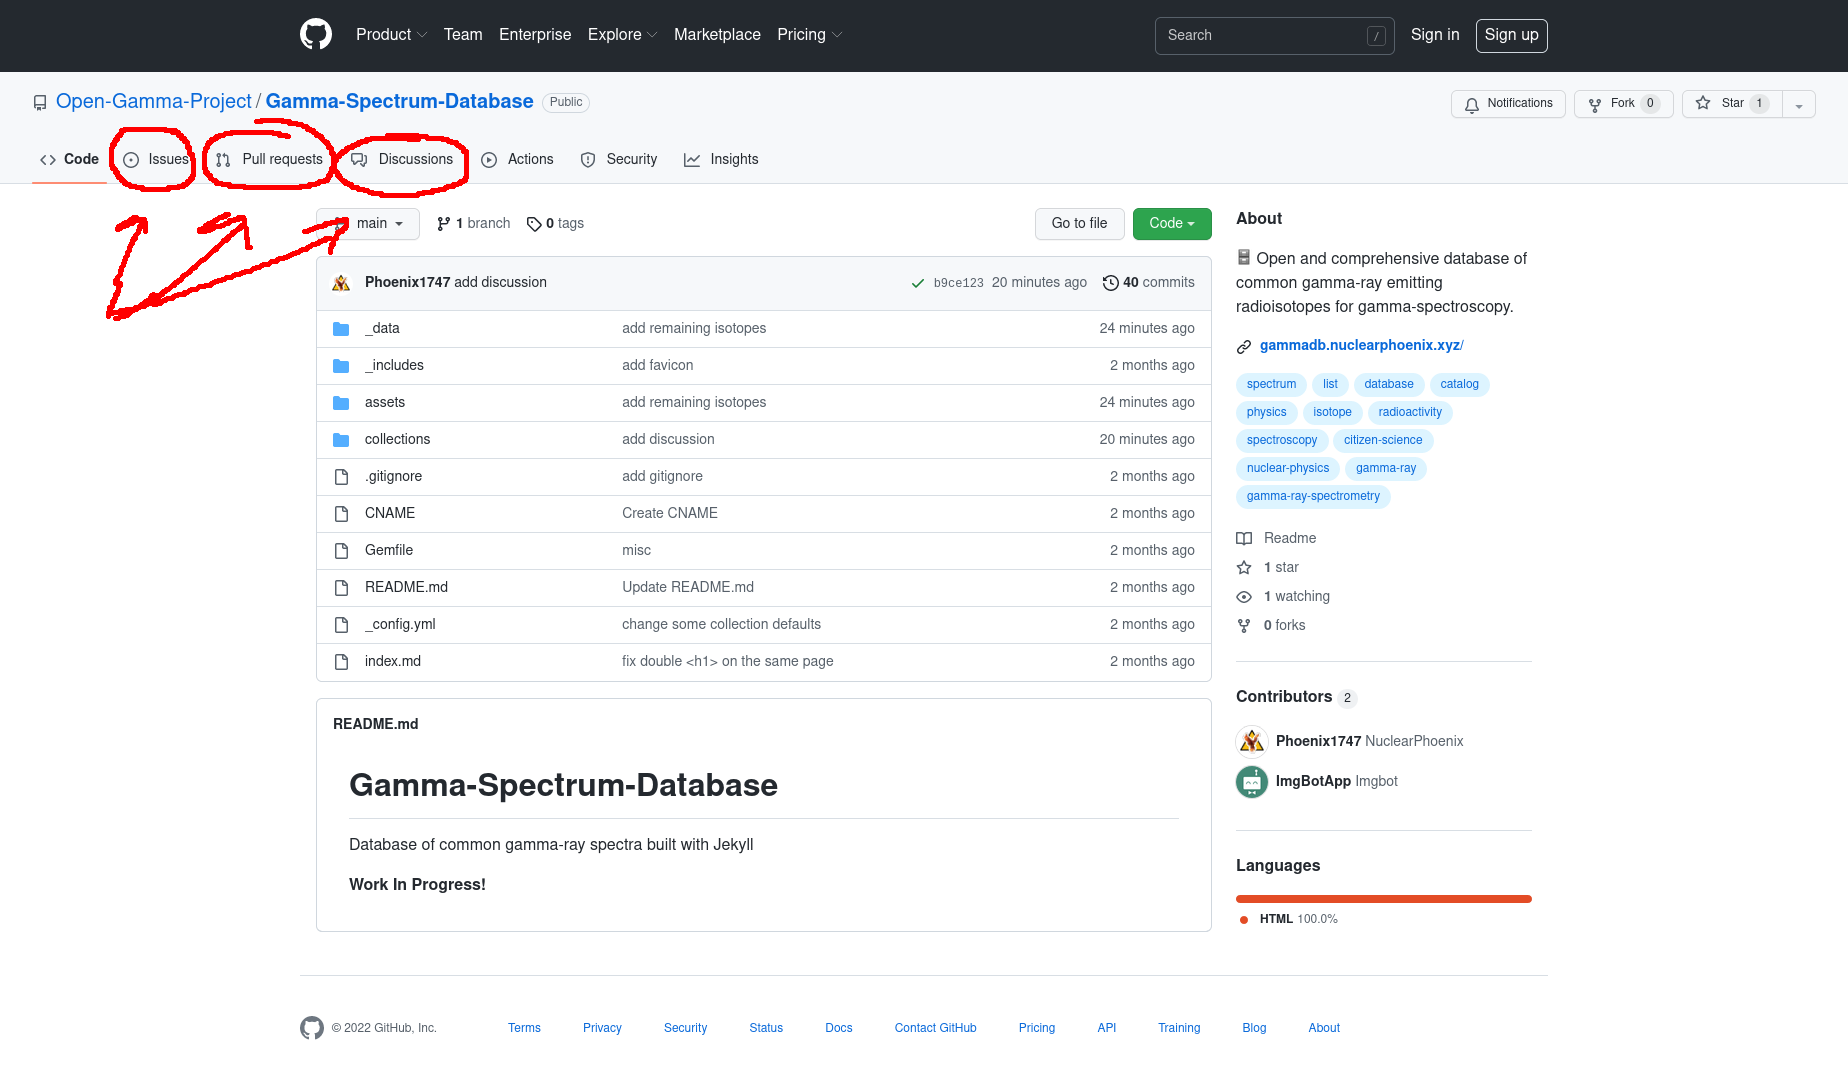
If you only want to submit the files you just collected, you will have to create a new issue. Tell us a bit about your setup (detector, scintillator, …), but most importantly what isotopes you measured, in what quantity, for how long and stuff like that. Just some info on top of the raw spectrum that I can add to the plot. Please also tell me if you don’t want to be explicitly mentioned in the database, otherwise I’ll add your username. Lastly, attach your files to the post.
That’s it! I’ll reply to you after some time and let you know if we’re ready to go.
If you really don’t want to do all of this via GitHub or simply don’t have an account, you can also send me an email. You can find my contact detail to the left of this post.
Comments